Case study
1. Dataset
Daily
hand-foot-mouth disease (HFMD) data from 19 hospitals in a district of China
from August 4 to September 4 in 2009 and 2010, respectively, are provided as
experimental historical data (see Fig. 1-1). The daily records of five
hospitals in 2010 in the same study region are provided as sample data (see
Fig. 1-2).
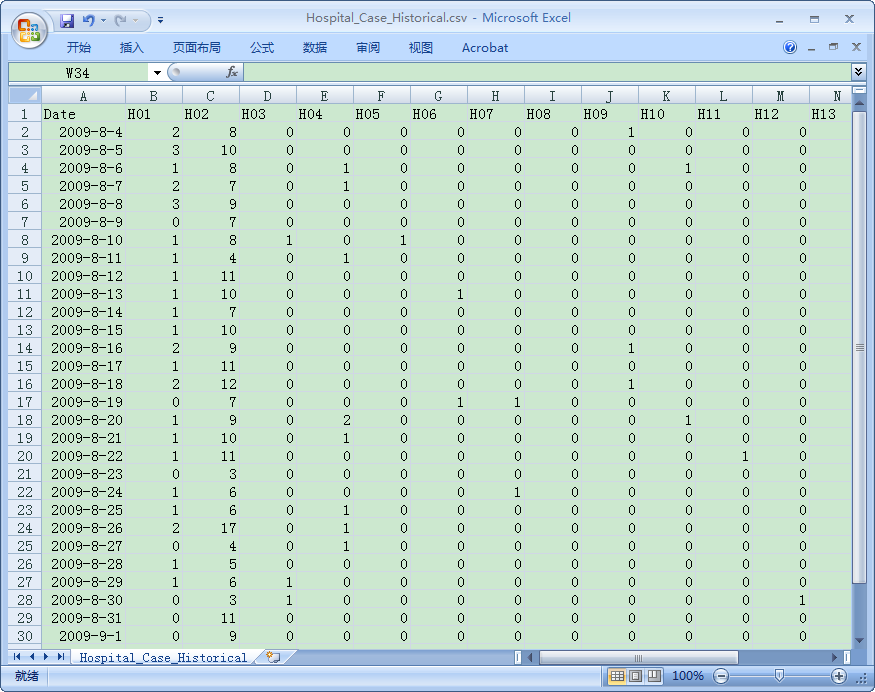
Fig. 1-1 Table of historical data
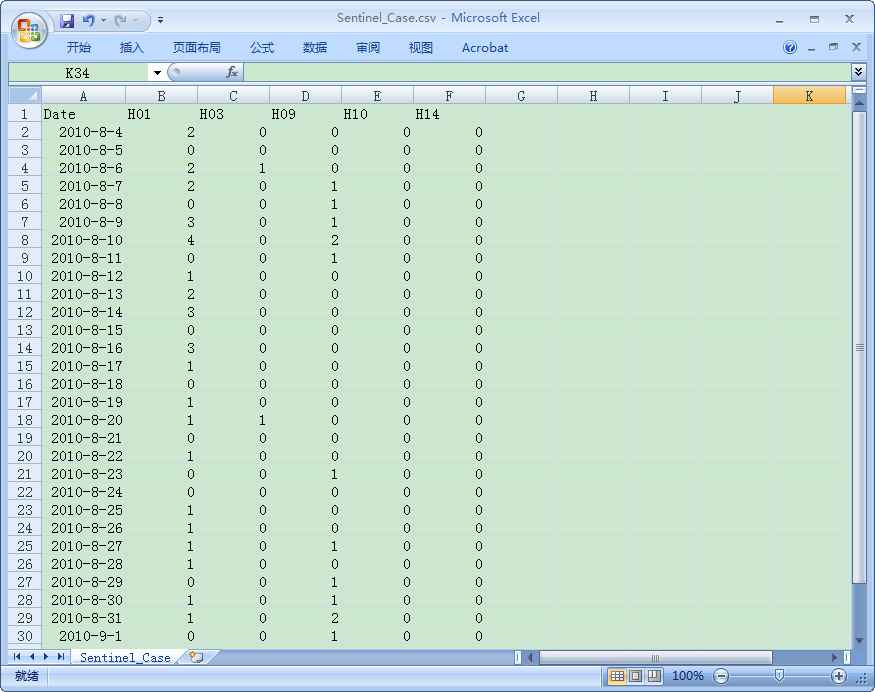
Fig. 1-2 Table of sample data
2. Exercise 1
Pop estimation
Step 1: To get started with the population estimation, first make sure
that the inputted data format is correct. Please refer to the above figures to
format the data (comma separated text file). Click ![]() to
add the sample, historical and result data files (see Fig. 2-1).
to
add the sample, historical and result data files (see Fig. 2-1).
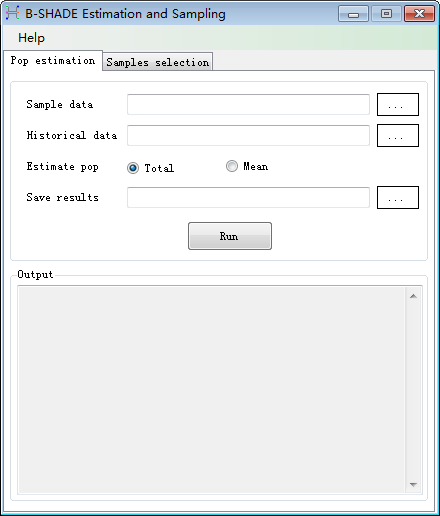
Fig. 2-1 Pop estimation
Step 2: Choose the total radio button to estimate the total/mean
population, and then click ![]() to
calculate the model, as shown in Fig. 2-2.
to
calculate the model, as shown in Fig. 2-2.
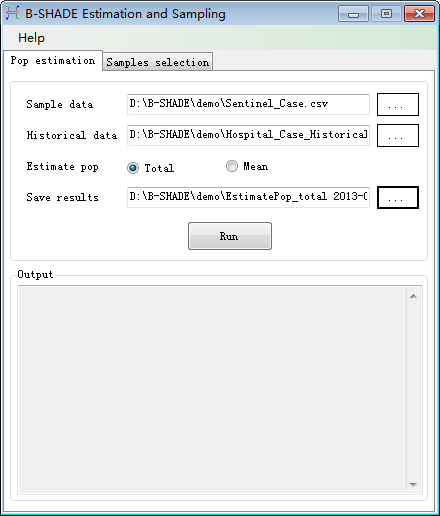
Fig. 2-2 Load data
Step 3: The estimated total population is shown at the bottom text box in
Fig. 2-3.
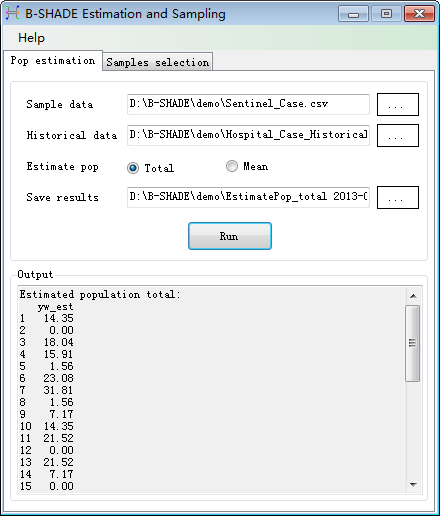
Fig. 2-3 Computed total population and
model parameters
3. Exercise 2
Samples selection with fixed number
Step 1: We continue
to use the experimental historical data. Input the historical data file, give
the required number n of sample stations (Fig. 3-1). Click
the “Options” button to set the advanced options about the adoped simulated
annealing algorithm, as shown in Fig. 3-2.
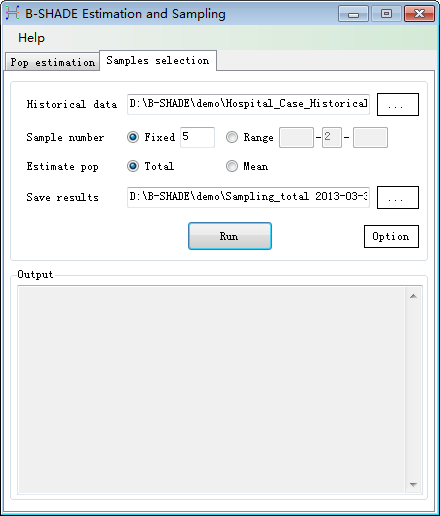
Fig. 3-1 Samples selection
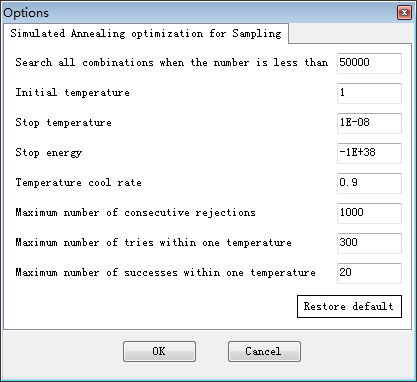
Fig. 3-2 Options
Step 2: The best
combination in the simulation is shown in Fig. 3-3. Among all combination
outcomes, the combination with the smallest estimated variance is selected as
the best sampling choice, whose standard deviation s is the least of all combinations
of 5 hospitals.
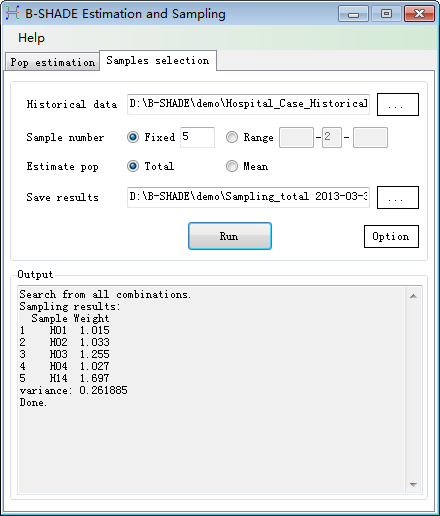
Fig. 3-3 Best combination of 5 stations
in total population
Samples selection within a range
We
can select samples with a batch mode that several sample schemes can be
outputed at same time (Fig. 3-4). User can select the optimal scheme by
considering both sample number and theoretical variance (V-N plot, Fig. 3-5).
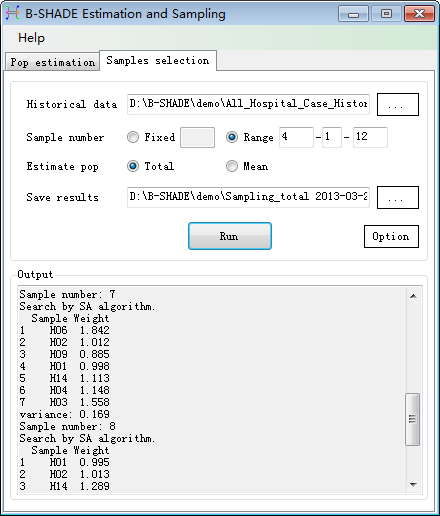
Fig. 3-4 Samples selection in batch
model
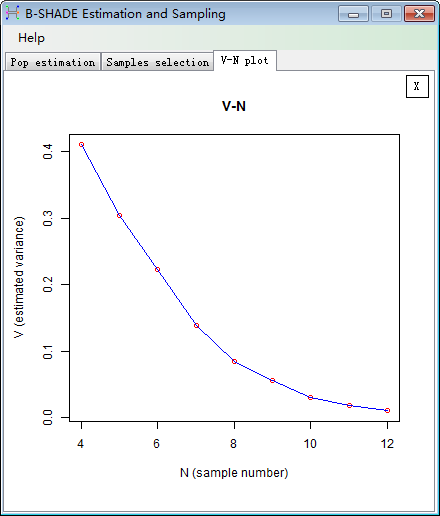
Fig. 3-5 V-N plot