
Estimate the total population of Heshun county in year 1998 according to the population data of 98 sample villages in the sampling investigation of Heshun county

Figure 1.Select the sampling steps
Defaults: “ New Sampling Design-> Having sampling site data ”.
“ Sampling Design File ” is the file that save the sampling design data, created and named by user, its postfix is.prj;
“Map of the region” is the vector map of the prepared sampling zone (it is the.shp file of ARCGIS);
“Sample Site Layer” is the gained data of the sampling sites (it is the.shp file of ARCGIS).
Step 2: Select the statistical features of the sample values
The selected sampling model is sandwich sampling, then enter the selection of the layer file ; select the corresponding layer file (the existed file that the layer are taken of the map of the region), select “SmUserID” in layer features, (the selected features is confirmed by user, if there are the units with the same values in a particular feature in the layer file, they belong to the same layer), a s shown in Figure 3,there is different “ SmUserID ” in each area, there are 5 layers in the whole area. Read the reporting unit (.shp file of ARCGIS), the reporting unit can be administration (for example, village 、 town) 、 natural unit 、 grid unit 、 or the other spatial units that user interests.
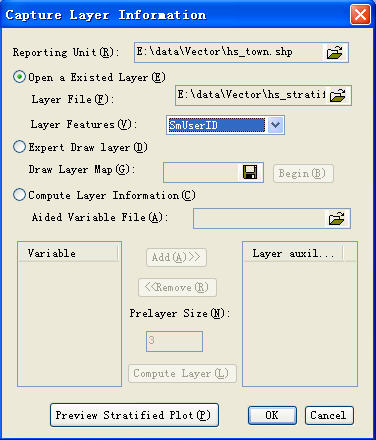
Figure 2.Select the layer file
User can preview the stratified p lot :

Select “VALUE” in “Sample Features”, sampling ratio is 30.1%, in Figure 4, the two columns in the table ( SmID 、 SmUserID) are automatically created by Supermap, the first column is the internal order of the data record, the second column is the order that signify the record by user, which can be modified according to the requirement, CODE is the number of the administrative village, NAME is the name of the administrative village, “Value” is the population size of the administrative villages that are investigated by user, which need to be inputted by user, LayerID is the layer number of the administrative village.
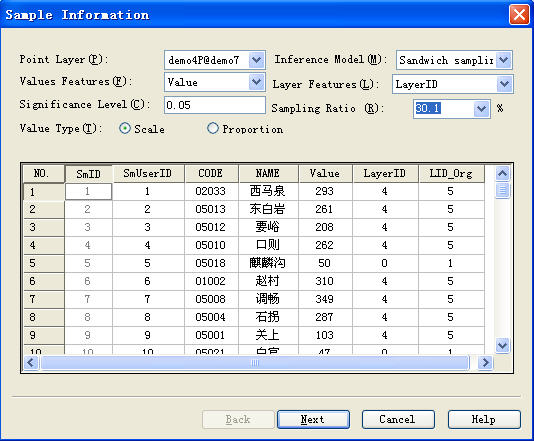
Figure4.Select the features of the sample values
Step 3: View the statistical results
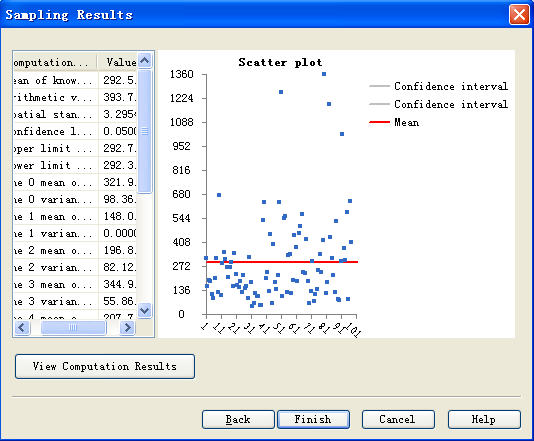
Figure5. View the scatter plot (X-axis is the administrative village size, Y- axis is the actual population value of each administrative village in investigation)
The statistical results of sample features are on the left, the scatter plot of sample value is on the right.
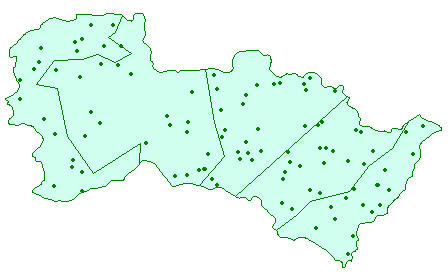
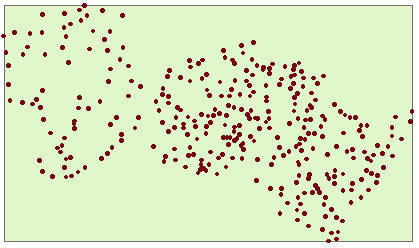
Figure6. Sample sites distribution of each layer
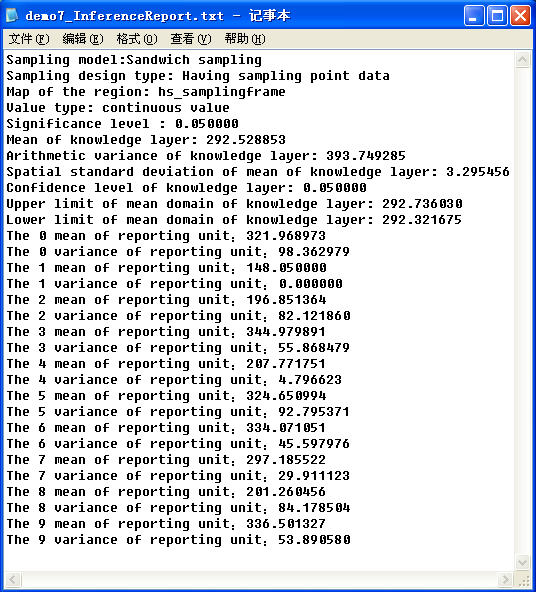
Figure7. Report of the statistical inference
(Because the sampling sites are generated randomly each time, and the change of each sample site is larger, the screenshots results and the calculation results may be not complete agreement)
Note: Before creating the new project file or importing the existed one, user need to close the opened project file.