
This section briefly introduces all sampling parameters and software parameters in the course of sampling, user can clearly understand the meaning of the various parameters, faster familiar with the basic knowledge of the software. The list is as follows: |
||
Coefficient of varianceAbsolute error |
||||
Total number of sample units in a population has probability of being chosen |
T rue variance (each sample may be calculated by measuring the value of the variance) came from last survey or historical data, can not obtain accurately
|
User expects to get variance from sampling survey |
Average value of sample. |
According to user input significance level of confidence and sample mean, a possible target value range can be obtained by means of an addition and subtraction to mean, this value is known as the absolute error |
According to mean normal probability distribution, the extent to which users hope that the results credible. Users have the credibility of the results by (1 - alpha / 2) % to that. |
When in the calculation of sample size, need to use t distribution, two parameters needed to calculate the t value, one is a sample size, another is an alpha. t distribution in the calculation will be used many times. Initial sample size through iteration calculations is obtained at the final convergence. The initial sample size in iteration is firstly used to calculate t value of the sample size, the system defaults to 1. (It is best not to amend) |
Before sampling, Users take a certain area of the investigation and obtain sample mean. |
Users from sampling expect to get the relative ratio between sample mean and the real object value (sample mean less real object value divided by real object values). |
Represent the percentage of the survey target value. |
The ratio of standard deviation and mean known as variance coefficient, written as C.V. Variance coefficient can eliminate units and (or) mean with difference from the average of two or more variance data on the impact of degree of comparison. |
Formula is: CV = σ/μ .
|
Prior to sampling, Users take a range of surveys and get rate of value from initial samples. |
Pre-sample the number of sample units used. |
Pre-sample, the samples have variance. |
The average sum of squared difference between sample data and sample mean is called sample variance; The square root of sample variance is called sample standard deviation. Sample variance and standard deviation measure fluctuations in a sample value. The bigger of samples variance or standard deviation, the greater volatility of the sample data. |
Mathematics in general use E ([XE (X)] ^ 2) to measure random variables X and its average E (X) the degree of deviation, known as the X variance |
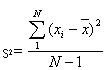 |
N is the population unit size, x i is the observed value of the ith sample unit ,
|
Normal cumulative distribution of inverse function, and be based on percentage of value. |
Number of sample unit collected |
The actual sample size is based on user input parameters to calculate the theoretical value multiplied by the rate of samples expanding to get expanding percentage of the number of samples |
Map for sampling, which is space for sample site and non-spatial features layer. It is different form sample region. Sample region may be a subset of map of the region of interesting. The features of sample information come from map of the region . |
Region for total possible sample units |
Sampling models here including Simple random sample, Systematic sample, Stratified random sample, Spatial random sample, Spatial stratified sample and Sandwich sample |
During the sample process, need to raster map of the region of interesting to obtain sample space. (after raster settings each raster could be a possible sample). Sampling unit is sampling resolution and also is the width of the smallest raster. |
The vector map raster for storage. |
Announced the results of the sampling unit, It is on top-level units in "sandwich" model, the final sample results is the unit value. |
The budget for the total sample (only reference value, did not participate in calculation. No restriction to basic costs and cost per sampling unit ). |
Cost for sampling. |
Each sample need to use the cost |
During the sampling process, need to raster map of the region to obtain sample space. |
For example: temperature (degree centigrade), rainfall(millimeter), output(ton), heavy-metal content(g/cm3), population density(number of population/km2) |
For example: morbidity(%), sex ratio(%), and so on. |
The whole surveyed objects, in sampling technology, population is evaluated by a number of samples |
Namely, sample site, which is the smallest unit of sampling. Sampling technology is to evaluate the population by selecting a number of sampling units and obtaining the features (call sample) |
The set of the sample unit. |
When statistically infer the population by the sample, the variance of the population mean is estimated. |
Before sampling. Users define files, save all the information in sampling process. |
File from the storage of sample site |
A file records input and output data and file storage address in the sampling process |
when sampling, the sample district is only a general geometry, has no feature information |