
- Double-click
 SSSampling.
Pop-up under interface:
SSSampling.
Pop-up under interface:
- Select " Having Sampling Data ".
- Under "Sample Design": Click on
 ,
Choose a suitable file path to save
the project files, such as: “sampling project”.
,
Choose a suitable file path to save
the project files, such as: “sampling project”.
- Under "Map of The Region" : Click on
 ,
choose the
hs_town.shp file.
,
choose the
hs_town.shp file.
- Under "Sample Site Layer": Click ,
choose sample site file.
- Click “Finish”
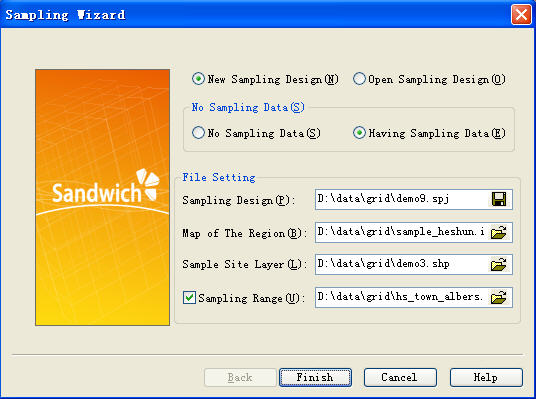
Figure 1.Starting interface
Step 2: Select Model
- Choose "Stratified sampling model"
There are three ways to set up stratification, but only one can be used at a time.
i. Open stratification: open the selected the stratification, then click to open the stratification file, pop-up dialog box. The selected stratification file must be the object of the regional set. The stratified region must coincide with the map of region interest, then select stratification attribute that is, identification of the different stratification features.
ii. Expert drawing stratification: first to create a new file to save the expert drawing stratification. Then click start drawing, the software will return to the map of region interest, experts draw the broken line to divide the map of region interest into a number of sub-regions. The each of sub-region is a stratum.
iii. Calculating stratification information: select stratification information, open assisted variable information file. According to certain features of the stratification of the file, the features in the table will be added to the right of the window, enter the number of layers before stratification( The default is 3), click the calculation of stratification to obtain the result of stratification.
Click on "Preview Stratified Plot", we can see the result of stratification.
- Select "Value Features"
- Select "Layer Features," generally is Layer ID
- Select "Scale" in the types of sample value(If the samples value attribute is the proportion, that is, maximum value less than 1, minimum value greater than 0, select the proportion of value)
- Select "Smapling Ratio" (random, half of choice about 10%)
- Filled out a confidence level 0.95
- Click “Next”
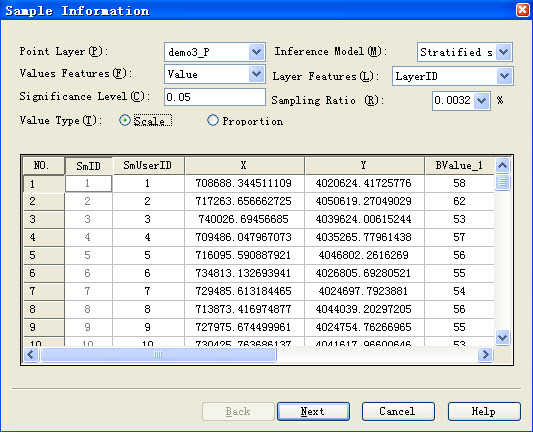
Figure 2.
Stratified sampling(
to make sample inference
)
Step 3: Sampling results
- Pop-up below dialog
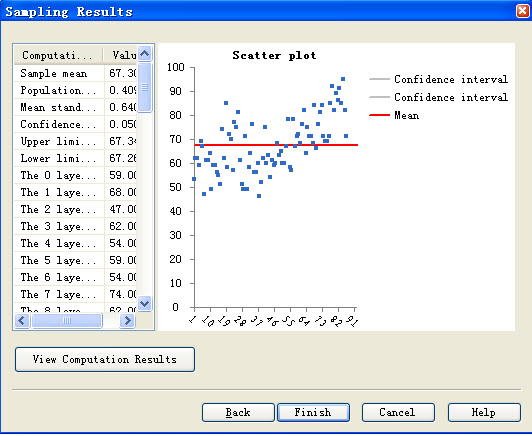
Figure 3.
Computation results of
stratified sampling
model
- Complete the calculation.